Monitoring
There are various solutions you can use to monitor a running XWiki instance:
- Install and configure Glowroot
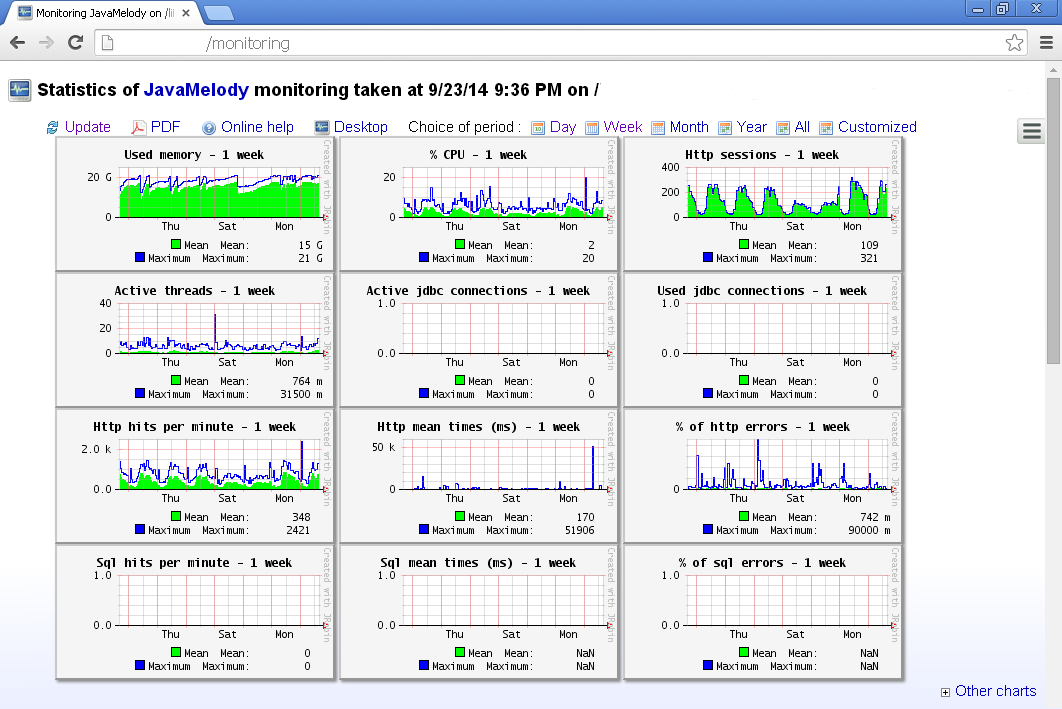
- Install and configure JavaMelody
- Use a Profiler. This has the advantage of providing advanced information, but has the drawback of being resource intensive and thus slowing the XWiki instance. It also requires a special startup script.
- Starting with XWiki 2.4M2 we're now using the JMX Technology to provide runtime monitoring of XWiki instances. The following features are currently available:
- Monitor the Velocity macro caches
- Monitor the JBossCache caches XWiki is using to cache Document data, Users & Groups data and more
- (starting with XE 3.1) Monitor the JGroups channel and protocols (when the XWiki Cluster feature is turned on)
- (starting with XE 3.1) Monitor the Logback Logging configuration and change it
Glowroot

There is nothing specific about XWiki when you install Glowroot, just follow the standard documentation.
JavaMelody
To install JavaMelody for XWiki follow these steps (see the JavaMelody user guide for more details):
- Download the latest javamelody.jar and jrobin-x.jar and put them in the WEB-INF/lib folder
- Edit web.xml and add the following information:
... <filter> <filter-name>monitoring</filter-name> <filter-class>net.bull.javamelody.MonitoringFilter</filter-class> </filter> <!-- to enable BASIC authentication with username and password, but do no want to use a realm and "security-constraint" The storage files of statistics and of graphs are stored in the temporary directory of the server, unless if you have defined the "storage-directory" path <filter> <filter-name>javamelody</filter-name> <filter-class>net.bull.javamelody.MonitoringFilter</filter-class> <init-param> <param-name>authorized-users</param-name> <param-value>user1:pwd1, user2:pwd2</param-value> </init-param> <init-param> <param-name>storage-directory</param-name> <param-value>/path/of/javamelody/stats</param-value> </init-param> </filter> --> ... other <filter>s from the default web.xml here ... <filter-mapping> <filter-name>monitoring</filter-name> <url-pattern>/*</url-pattern> </filter-mapping> ... other <filter-mapping>s from the default web.xml here ... <listener> <listener-class>net.bull.javamelody.SessionListener</listener-class> </listener> ... other <listener>s from the default web.xml here ... ... - Edit hibernate.cfg.xml and add:
<property name="jdbc.factory_class">net.bull.javamelody.HibernateBatcherFactory</property>
Then restart XWiki and access JavaMelody at http://localhost:8080/xwiki/monitoring.
JMX Console
Since JMX is a standard you can use any JMX-compatible monitoring console (most application servers provide a web-based JMX console). There's also a console called JConsole which is bundled by default in the Java Runtime you're using. To start it, simply execute the jconsole executable.
XWiki Caches Monitoring
XWiki can use different cache implementations. The JBoss Cache and JBoss Infinispan implementations have nice JMX features available as shown below.
Starting with XWiki 3.3 the default implementation is JBoss Infinispan.
With JBoss Infinispan
Since JBoss Infinispan natively supports JMX we benefit from this feature directly (JBoss documentation available here).
Example showing the cache list and some statistic for a given cache:

Example showing how to clear a given cache from all its entries:

With JBoss Cache
Since JBoss Cache natively supports JMX we benefit from this feature directly (JBoss documentation available here).
Example showing all JBoss Caches in memory in a running instance, showing all the elements in the cache (example on the document cache):

Example showing Cache stats (for the document cache):

Velocity Cache Monitoring
Velocity caches Velocity macros. XWiki offers a JMX view of the content of the Velocity caches.
JConsole examples showing the Velocity Cache monitoring:


JGroups Monitoring
JConsole example showing the JGroups monitoring:

Interesting things to do on JGroups in the JMX console:
- Change the log level on the protocols to enable logging
- Disconnect a node from the cluster and reconnect it
Logback Monitoring
JConsole example showing how to modify the logging level for a category:

Tomcat JMX Proxy Servlet
Tomcat has a JMX Proxy Servlet bundled in their manager webapp (see here and here for more details on Tomcat and JMX]].
Here's some useful URLs to use the JMX Servlet Proxy to list and set JGroups Protocol Levels:
- To display the current log level for the TCPPING protocol: http://localhost:8080/manager/jmxproxy?qry=jgroups:type=protocol,cluster=event,protocol=TCPPING
- To set the log level to info for the TCPPING protocol: http://localhost:8080/manager/jmxproxy?set=jgroups:type=protocol,cluster=event,protocol=TCPPING&att=Level&val=info


